Confirming you are not from the U.S. or the Philippines

Bu beyanı vererek, şunları açıkça beyan ve teyit ederim:
  • Bir ABD vatandaşı değilim veya ABD'de ikamet etmiyorum.
  • Filipinler'de ikamet etmiyorum
  • ABD'de yaşayan kişilerin hisselerinin/oy haklarının/çıkarlarının doğrudan veya dolaylı olarak %10'undan fazlasına sahip değilim ve/veya ABD vatandaşlarını veya ABD'de yaşayanları başka yollarla kontrol etmiyorum.
  • Hisselerin/oy haklarının/çıkarlarının %10'undan fazlasının doğrudan veya dolaylı mülkiyeti altında tutan ve/veya başka araçlarla kullanılan ABD vatandaşı veya vergi mükellefinin kontrolü altında değilim.
  • FATCA Bölüm 1504(a) uyarınca, ABD vatandaşları veya mükellefleri ile herhangi bir bağlantım yoktur.
  • Yanlış beyanda bulunmanın getirdiği sorumluluğun farkındayım.
Bu beyanın amaçları doğrultusunda, ABD'ye bağımlı tüm ülkeler ve topraklar, ABD'nin ana topraklarına eşittir. Bu beyanımın ihlalinden kaynaklanan veya bununla ilgili herhangi bir iddiaya karşı Octa Markets Incorporated'ı, yöneticilerini ve görevlilerini savunmayı ve zarar görmemesini sağlamayı taahhüt ederim.
Kendimizi gizliliğinize ve kişisel bilgilerinizin güvenliğine adadık. E-postaları yalnızca özel teklifler ve ürünlerimiz ve hizmetlerimiz hakkında önemli bilgiler sağlamak için topluyoruz. E-posta adresinizi göndererek bizden bu tür mektupları almayı kabul etmiş olursunuz. Abonelikten çıkmak istiyorsanız veya herhangi bir sorunuz ya da endişeniz varsa Müşteri Desteğimize yazın.
Octa trading broker
Yatırım hesabı aç
Back

EUR/USD Price Analysis: Bears are lurking with eyes on 61.8% Fibo target

  • EUR/USD struggles to convince on the upside and bears are lurking.
  • A downside test of the 61.8% Fibo of the daily impulse could be on the cards. 

EUR/USD is on the verge of a significant correction according to the following top-down analysis that illustrates the market structure and bearish bias across the monthly, weekly and daily time frames. 
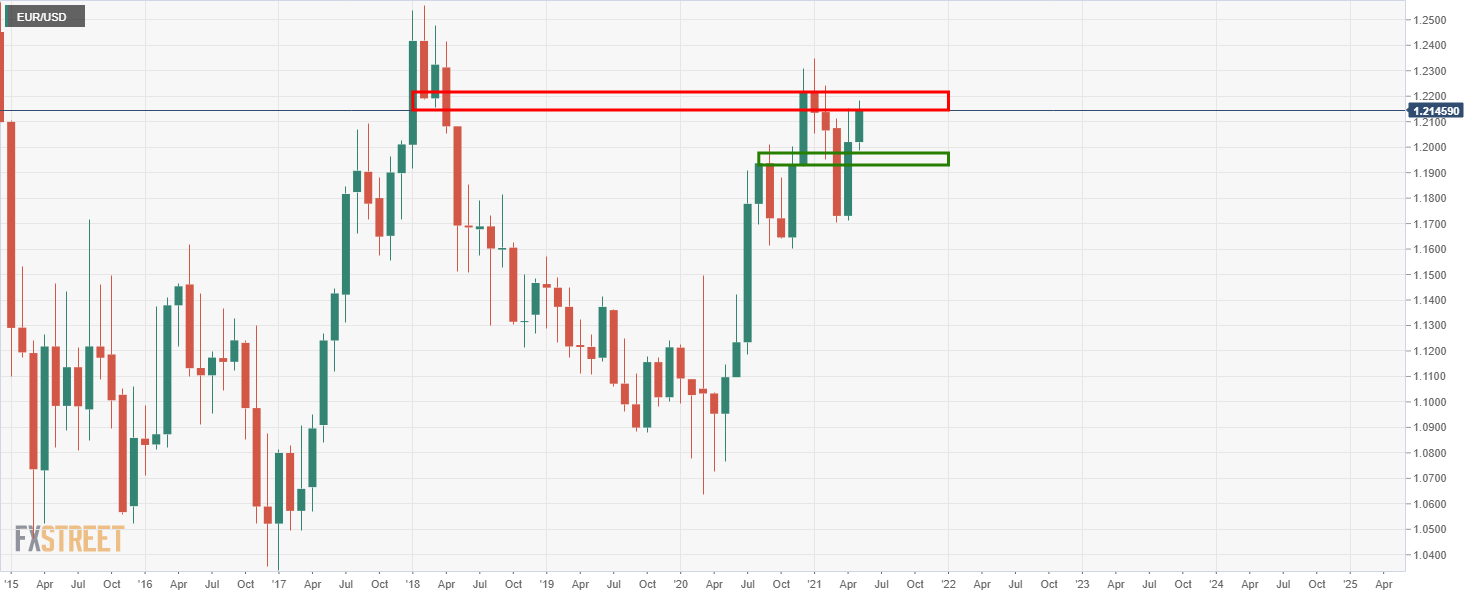
Monthly chart

The bulls need to clear the monthly resistance at this juncture or face an onslaught from the bears to test the support structure. 
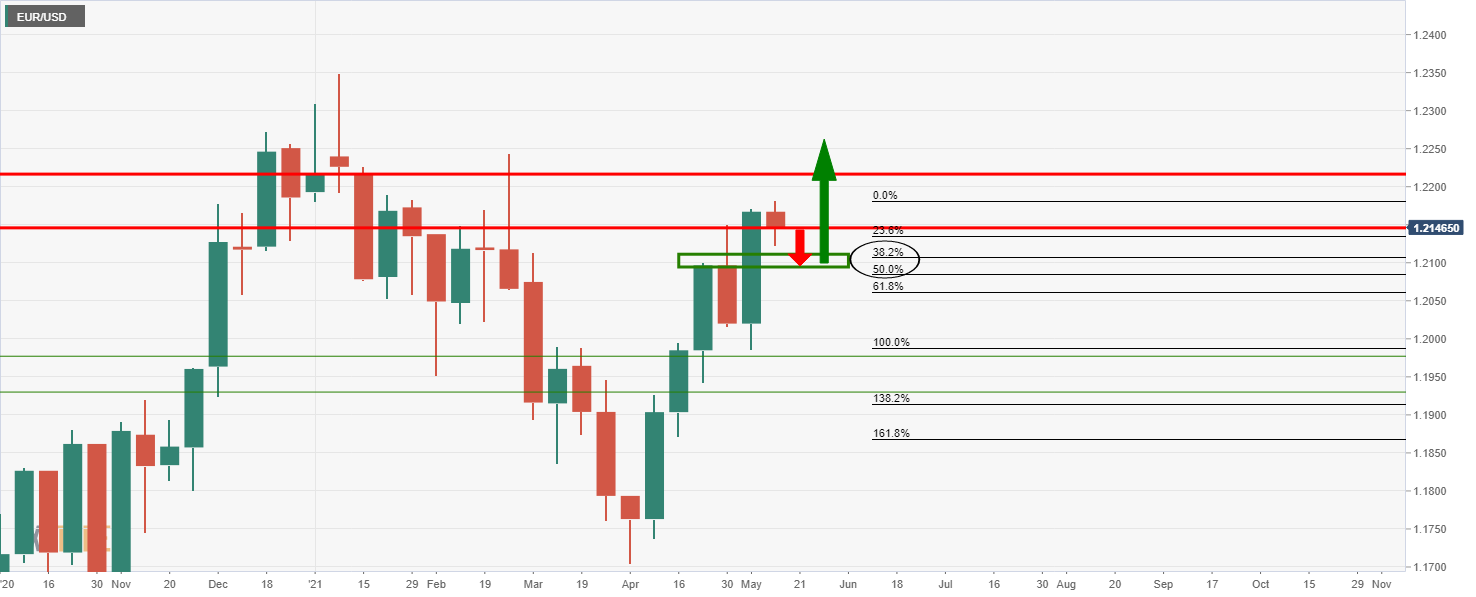
Weekly chart

The weekly chart is showing signs of upside exhaustion and would be expected to see the price to the 38.2% or the 50% mean-reversion targets. 
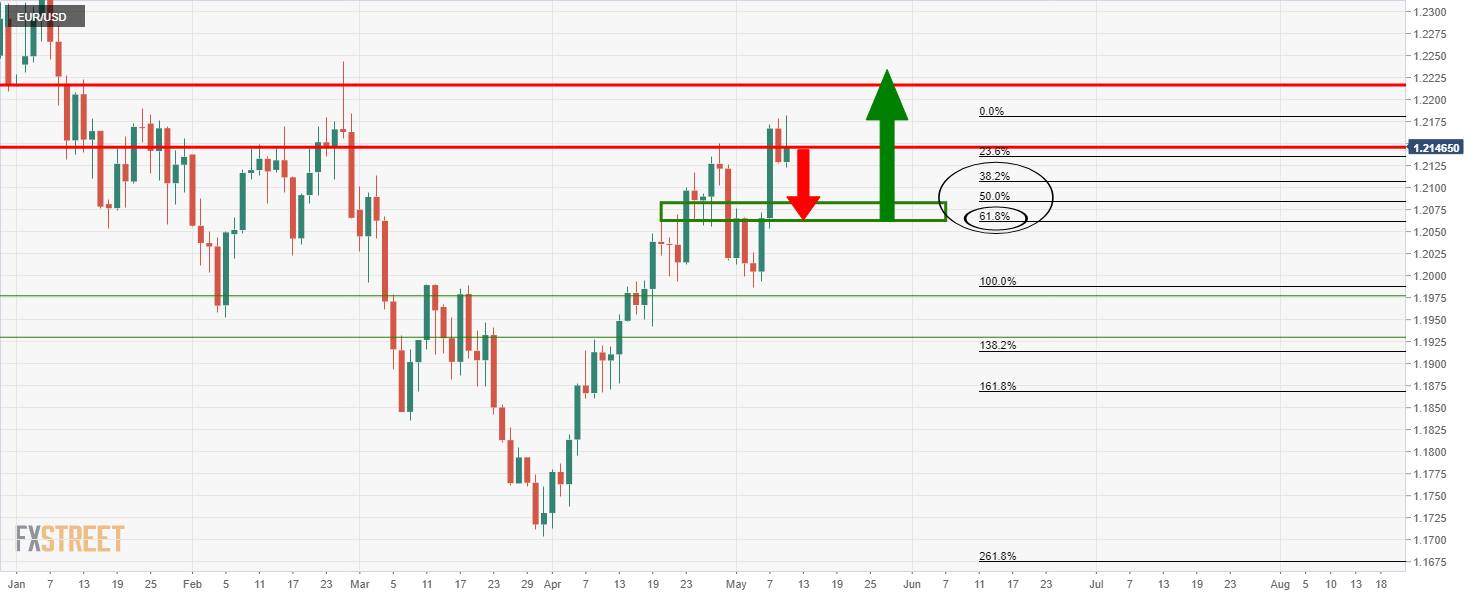
Daily chart

The daily chart is showing a W-formation on the candles.

The rule of thumb is that the majority of such formations will see a restest of the prior highs of the pattern which will act as support prior to a bullish continuation. 

In this case, the 61.8% Fibonacci is the key target. 


Forex Today: US inflation takes center stage

What you need to know on Wednesday, May 12: Tensions mounted as the focus is on US inflation data to be out on Wednesday. Higher commodities prices se
Devamını oku Previous

United States API Weekly Crude Oil Stock increased to -2.533M in May 7 from previous -7.688M

United States API Weekly Crude Oil Stock increased to -2.533M in May 7 from previous -7.688M
Devamını oku Next