Confirming you are not from the U.S. or the Philippines

Bu beyanı vererek, şunları açıkça beyan ve teyit ederim:
  • Bir ABD vatandaşı değilim veya ABD'de ikamet etmiyorum.
  • Filipinler'de ikamet etmiyorum
  • ABD'de yaşayan kişilerin hisselerinin/oy haklarının/çıkarlarının doğrudan veya dolaylı olarak %10'undan fazlasına sahip değilim ve/veya ABD vatandaşlarını veya ABD'de yaşayanları başka yollarla kontrol etmiyorum.
  • Hisselerin/oy haklarının/çıkarlarının %10'undan fazlasının doğrudan veya dolaylı mülkiyeti altında tutan ve/veya başka araçlarla kullanılan ABD vatandaşı veya vergi mükellefinin kontrolü altında değilim.
  • FATCA Bölüm 1504(a) uyarınca, ABD vatandaşları veya mükellefleri ile herhangi bir bağlantım yoktur.
  • Yanlış beyanda bulunmanın getirdiği sorumluluğun farkındayım.
Bu beyanın amaçları doğrultusunda, ABD'ye bağımlı tüm ülkeler ve topraklar, ABD'nin ana topraklarına eşittir. Bu beyanımın ihlalinden kaynaklanan veya bununla ilgili herhangi bir iddiaya karşı Octa Markets Incorporated'ı, yöneticilerini ve görevlilerini savunmayı ve zarar görmemesini sağlamayı taahhüt ederim.
Back

WTI Price Analysis: Fails to keep bounce off $38.80 as sellers turn most bearish since late-April

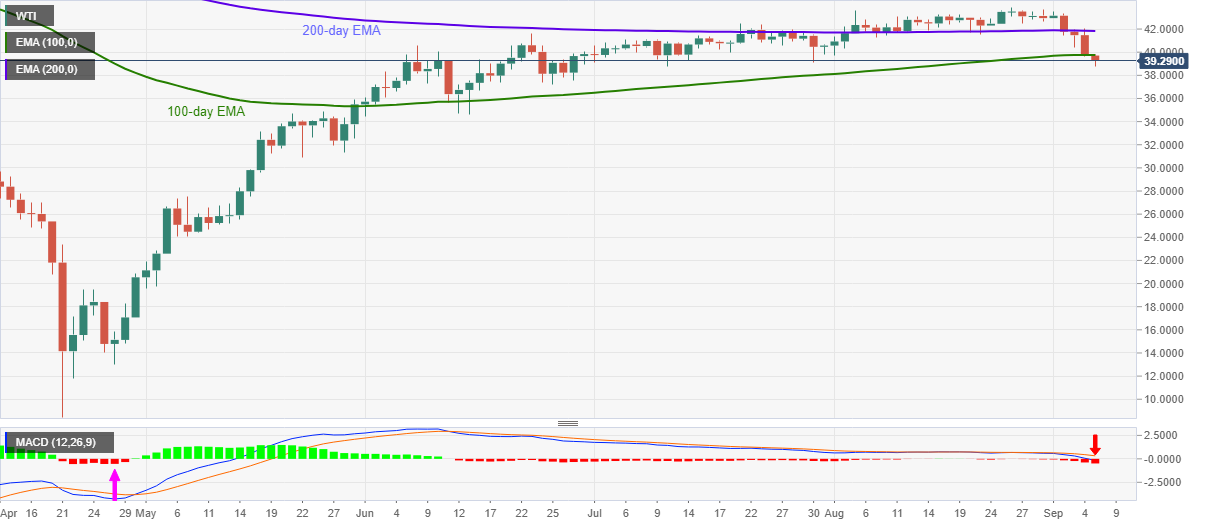
  • WTI takes a U-turn from $39.78 as 100-day EMA probes pullback moves.
  • MACD histogram marks the strongest bearish signal since April 28.
  • Sustained trading below 200-day, 100-day EMA keeps sellers hopeful.

WTI witnesses fresh selling while flashing $39.35 as a quote during the pre-European trading on Monday. The energy benchmark earlier dropped to $38.80 before recovering to $39.78. Though, 100-day EMA keeps the quote’s recent upside capped while also pushes the black gold to flash 0.87% losses by the press time.

In addition to the failures to cross 100-day EMA, bearish MACD also favor sellers. The MACD histogram is at the lowest levels since April 28, which in turn suggests the commodity’s further weakness.

Hence, the bears can aim for late-June lows near $37.15 during the further weakness while $38.00 may act as immediate support.

Though, any further downside past-$37.15 will make the sellers aim for June month’s low, also including May month’s top, near $34.60.

Alternatively, 100-day and 200-day SMA, $39.75 and $41.83 respectively, will act as nearby strong resistances for the traders to watch in addition to $40.00 round-figures.

It should, however, be noted that the bulls will remain cautious unless the quote manages to cross February month’s low near $44.00.

WTI daily chart
Trend: Bearish


Crude Oil Futures: Further downside on the cards

Traders increased their open interest positions by more than 6K contracts at the end of last week, in light of preliminary figures from CME Group. Vol
Devamını oku Previous

Norway Manufacturing Output above expectations (-0.3%) in July: Actual (1.8%)

Norway Manufacturing Output above expectations (-0.3%) in July: Actual (1.8%)
Devamını oku Next