GBP/JPY Price Analysis: Bears struggle between key Fibonacci levels amid oversold RSI
- GBP/JPY remains on the back foot near the 4.5-month low.
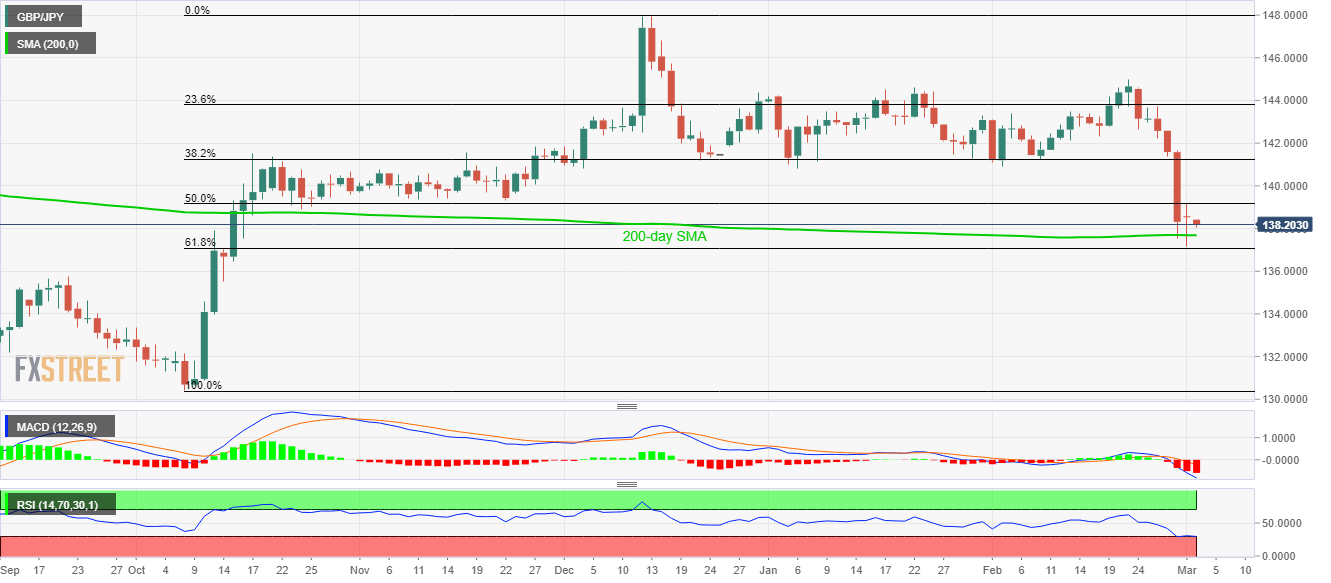
- Bearish MACD confronts the oversold RSI to keep the quote between 50% and 61.8% Fibonacci retracement levels.
- 200-day SMA acts as immediate support.
GBP/JPY declines to 138.20 during the Asian session on Tuesday. In doing so, the pair stays within 50 and 61.8% Fibonacci retracements of its October-December upside amid mixed signals from technical indicators like RSI and MACD.
That said, the pair currently declines towards a 200-day SMA level of 137.65 ahead of re-testing 61.8% Fibonacci retracement, around 137.10.
Though, sellers will look for entry only if the pair provides a daily closing below 137.00. In doing so, September month high near 135.75 will be on their radars.
Meanwhile, buyers will wait for the pair’s daily close beyond 50% Fibonacci retracement level near 139.20 before confronting multiple resistances around 139.30/353.
Should there be a clear run-up beyond 139.35, 140.00 and early-February low near 141.00 will return to the charts.
GBP/JPY daily chart
Trend: Bearish