Back
10 Feb 2020
GBP/USD Asia Price Forecast: Pound vulnerable near 2020 lows vs. greenback
- GBP/USD is under bearish pressure meandering near 2020 lows.
- The levels to beat for bears are the 1.2910/1.2885 support levels.
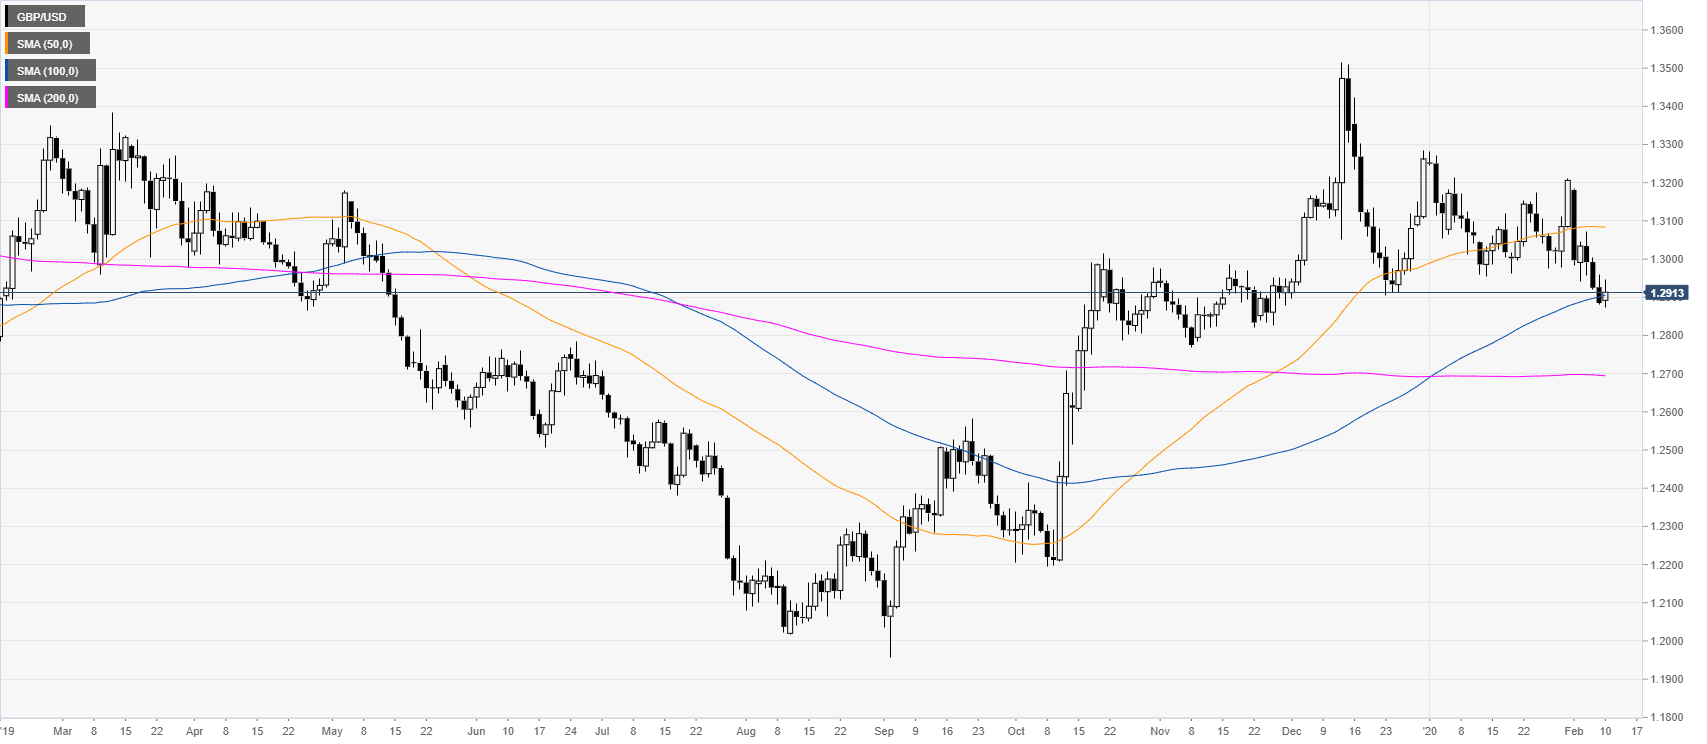
GBP/USD daily chart
Following the October and December bullish runs, GBP/USD is trading in a rectangle consolidation above the 100/200-day simple moving averages (SMAs).
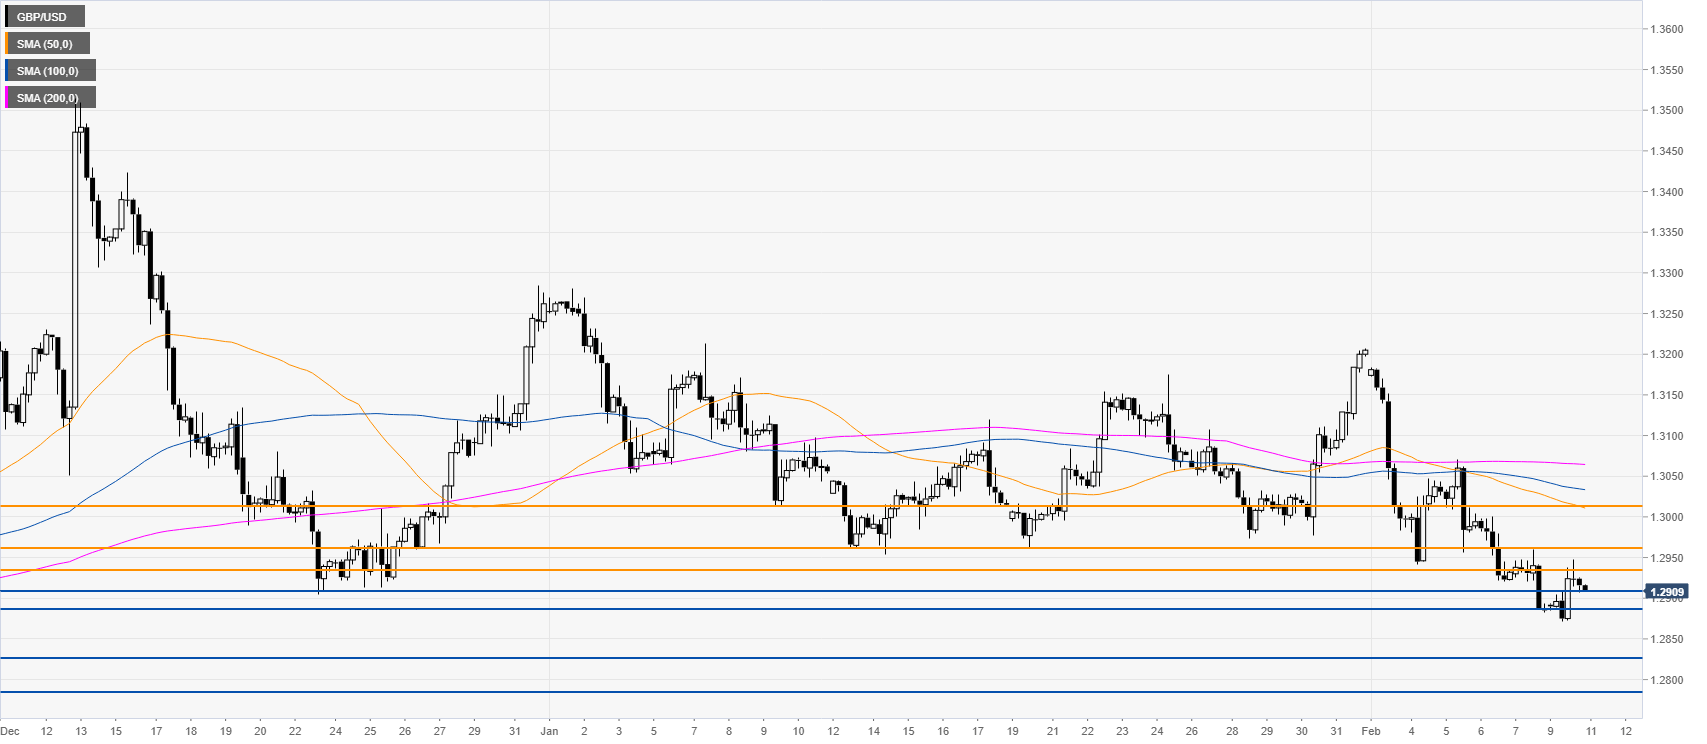
GBP/USD four-hour chart
The spot remains under bearish pressure below the main SMAs. The sellers are challenging the 1.2910 support and a break below the level can lead to extra losses towards the 1.2885, 1.2830 and 1.2785 price levels. Corrections up can find resistance near 1.2933, 1.2960 and 1.3000 figure, according to the Technical Confluences Indicator.
Resistance: 1.2933, 1.2960, 1.3000
Support: 1.2910, 1.2885, 1.2830, 1.2785
Additional key levels