USD/CAD Price Analysis: Struggles between 10/21-day SMA
- USD/CAD clings to 23.6% Fibonacci retracement of September 2019 to January 2020 fall.
- 50-day SMA, 50% Fibonacci retracement adds to the resistance.
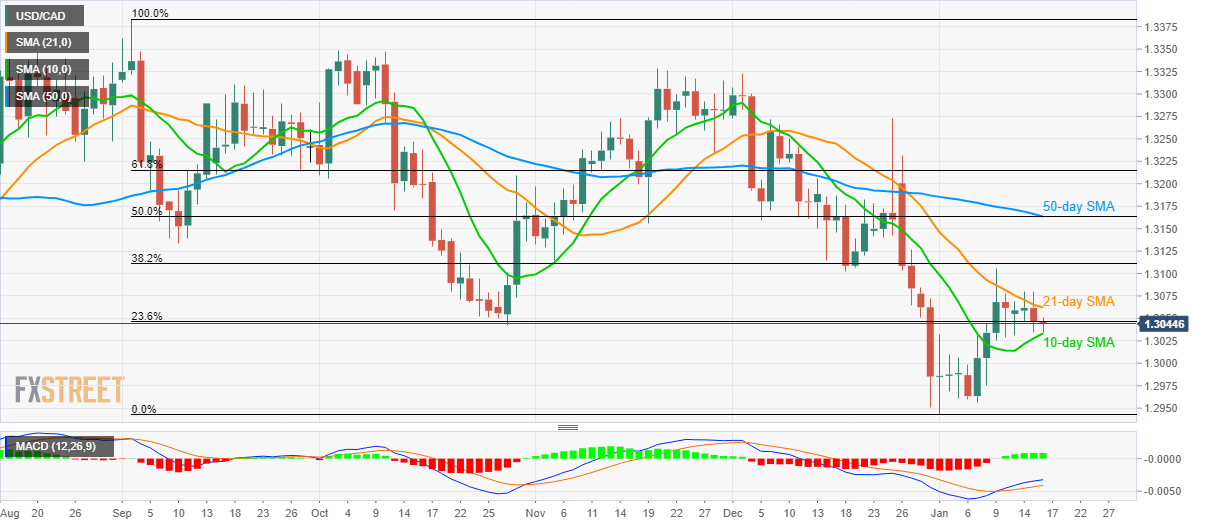
USD/CAD remains mostly unchanged to 1.3045 while heading into the European session on Thursday. The pair maintains its trading between the 10-day and 21-day SMAs while sticking to 23.6% Fibonacci retracement of declines from September 2019 peak to the year-start bottom.
Hence, fewer moves are expected until the quote breaks either side of the 35-pip range between the 21-day SMA level of 1.3065 or 10-day SMA level of 1.3030.
While the upside clearance will propel the quote towards a 38.2% Fibonacci retracement level of 1.3110, sellers will confront 1.3000 on the downside break of 1.3030 comprising 10-day SMA.
On a wider frame, a confluence of 50-day SMA and 50% Fibonacci retracement near 1.3160/65 and the recent lows near 1.2945/40 will be the keys to watch.
USD/CAD daily chart
Trend: Sideways