Confirming you are not from the U.S. or the Philippines

Bu beyanı vererek, şunları açıkça beyan ve teyit ederim:
  • Bir ABD vatandaşı değilim veya ABD'de ikamet etmiyorum.
  • Filipinler'de ikamet etmiyorum
  • ABD'de yaşayan kişilerin hisselerinin/oy haklarının/çıkarlarının doğrudan veya dolaylı olarak %10'undan fazlasına sahip değilim ve/veya ABD vatandaşlarını veya ABD'de yaşayanları başka yollarla kontrol etmiyorum.
  • Hisselerin/oy haklarının/çıkarlarının %10'undan fazlasının doğrudan veya dolaylı mülkiyeti altında tutan ve/veya başka araçlarla kullanılan ABD vatandaşı veya vergi mükellefinin kontrolü altında değilim.
  • FATCA Bölüm 1504(a) uyarınca, ABD vatandaşları veya mükellefleri ile herhangi bir bağlantım yoktur.
  • Yanlış beyanda bulunmanın getirdiği sorumluluğun farkındayım.
Bu beyanın amaçları doğrultusunda, ABD'ye bağımlı tüm ülkeler ve topraklar, ABD'nin ana topraklarına eşittir. Bu beyanımın ihlalinden kaynaklanan veya bununla ilgili herhangi bir iddiaya karşı Octa Markets Incorporated'ı, yöneticilerini ve görevlilerini savunmayı ve zarar görmemesini sağlamayı taahhüt ederim.
Kendimizi gizliliğinize ve kişisel bilgilerinizin güvenliğine adadık. E-postaları yalnızca özel teklifler ve ürünlerimiz ve hizmetlerimiz hakkında önemli bilgiler sağlamak için topluyoruz. E-posta adresinizi göndererek bizden bu tür mektupları almayı kabul etmiş olursunuz. Abonelikten çıkmak istiyorsanız veya herhangi bir sorunuz ya da endişeniz varsa Müşteri Desteğimize yazın.
Octa trading broker
Yatırım hesabı aç
Back

EUR/USD Price Analysis: Bulls struggle as pair retreats from 100-day SMA

  • EUR/USD posts mild gains but faces rejection near the 100-day SMA.
  • RSI remains in positive territory but shows signs of fading bullish momentum.

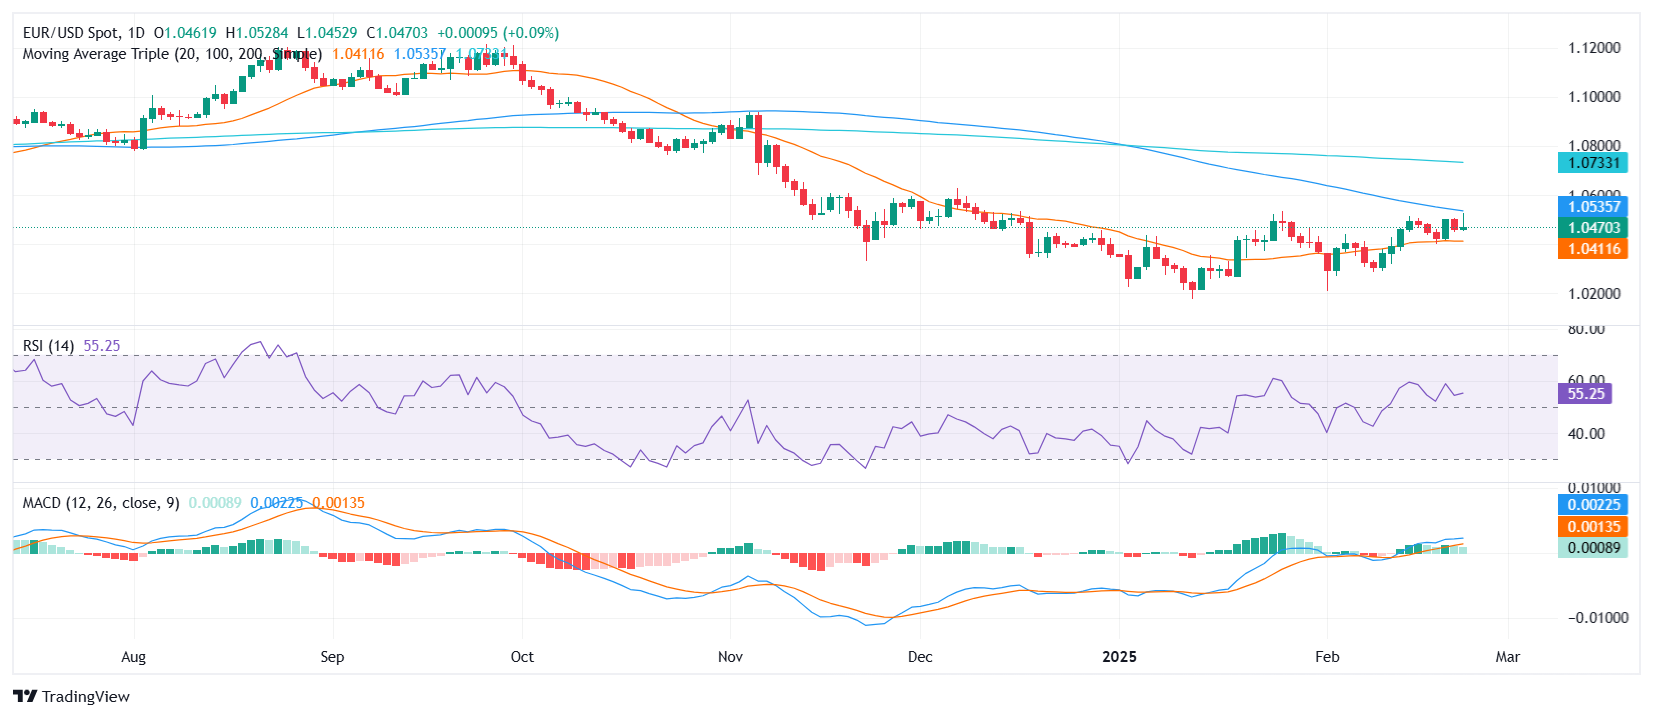
The EUR/USD pair started the week on a cautiously positive note, climbing toward recent highs before encountering strong resistance near the 100-day Simple Moving Average (SMA). After briefly reaching the 1.0530 area, the pair lost momentum and pulled back toward the 1.0470 zone. This retreat suggests that bullish efforts are beginning to stall, with sellers gradually regaining control.

Technical signals highlight this shift in sentiment. The Relative Strength Index (RSI) remains in positive territory but is flattening, indicating that bullish momentum may be running out of steam. The Moving Average Convergence Divergence (MACD) histogram shows flat green bars, reinforcing the notion of weakening upward pressure. Without a decisive break above the 100-day SMA, bulls could struggle to maintain control.

In the short term, the key focus will be on whether the pair can defend support around the 1.0450 zone. A break below this level could invite further losses, pushing the pair toward the 20-day SMA. On the upside, a clear breach of the 100-day SMA would be required to revive bullish momentum and open the door for a sustained recovery. For now, the technical indicators suggest that time may be running out for the bulls to regain traction.

EUR/USD daily chart

Gold price hits all-time high at $2,956 as trade uncertainty lingers

Gold's price rose to a new record high of $2,956 in early trading on Monday during the North American session as the Greenback stayed firm and US yields remained virtually unchanged.
Devamını oku Previous

GBP/USD holds firm after hitting 9-week high

The Pound Sterling remains firm against the Greenback during the North American session on Monday yet retraced earlier gains after hitting a 9-week high of 1.2690 amid some US dollar weakness.
Devamını oku Next