
En iyi spreadlerimiz ve koşullarımız
 Daha fazlasını öğrenin

EUR/GBP continues trickling lower in a falling channel. The declining sequence of peaks and troughs indicates the pair is in a short-term downtrend, and given “the trend is your friend” this biases prices to further weakness.
EUR/GBP 4-hour Chart
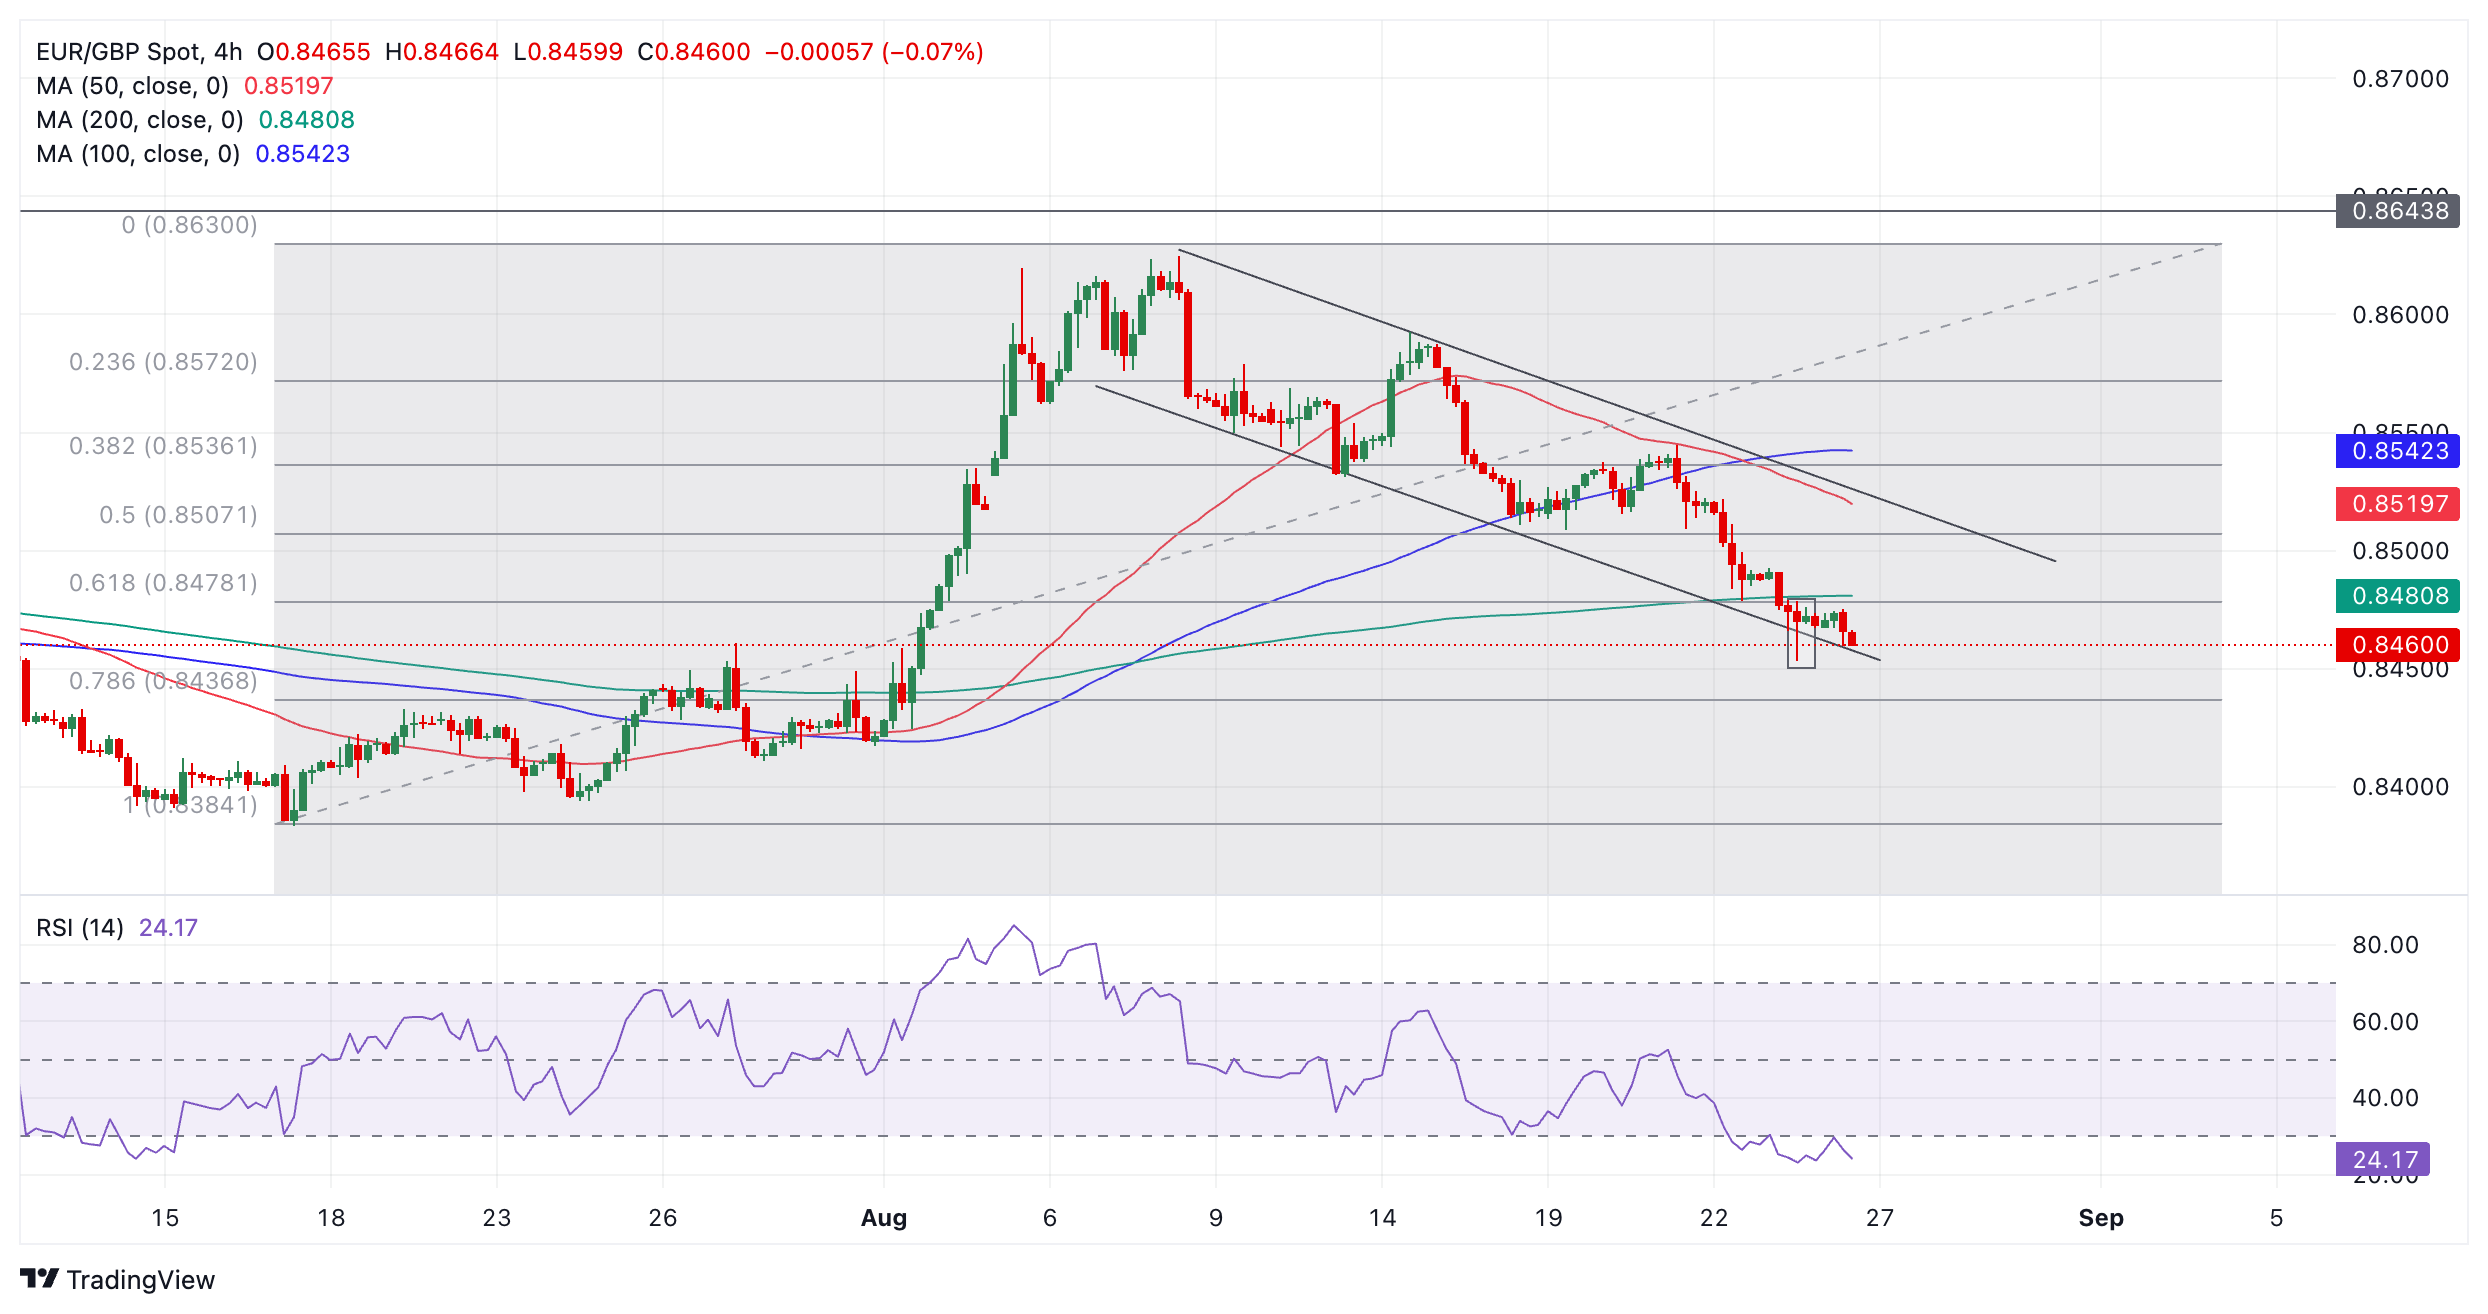
The pair has touched down on the lower channel line, a historical support level that previously provided the launch pad for counter-trend reactions higher. There is a chance the same thing could happen again.
The Relative Strength Index (RSI) is heavily oversold indicating traders should not add to their short positions as there is a greater risk of a recovery. RSI can remain oversold for long periods whilst prices continue falling but EUR/GBP has now been oversold for 14 periods on the 4-hour chart which is already quite long. Traders should wait for RSI to exit oversold on a closing basis and re-enter neutral territory before placing buy orders.
EUR/GBP has now broken below the 200-period Simple Moving Average (SMA) and the 0.618 Fibonacci retracement level of the late-June and early-August rally – both bearish signs. On the daily chart (not shown) it is trading just below the key 50-day SMA but it is difficult to determine whether it has decisively broken below the 50-day, which could still offer support for a rebound.
The price itself formed a bullish Hammer Japanese candlestick reversal pattern on August 23 (bold rectangle on chart above). This occurred after it briefly fell below the channel line then recovered in the same 4-hour period. The pattern was followed by a green up candle providing bullish confirmation of a near-term recovery. However, the price has so far failed to rise. If EUR/GBP breaks below the Hammer candle’s lows at 0.8453 it will signal further downside. If the low holds hope of a recovery remains alive.
Given the downtrend in the short-term, EUR/GBP there is still a chance of another break below the channel line. A decisive break below the lower channel line would validate such a breakout. It would be a very bearish sign but the move lower would be unlikely to last long. Such moves are often signs of exhaustion.
A decisive break would be one accompanied by a longer-than-average red candlestick which closed below the channel line near its low, or three red candlesticks in a row that broke below the level.
The long-term trend (weekly chart) is still bearish whilst the medium-term trend is bullish.


