
En iyi spreadlerimiz ve koşullarımız
 Daha fazlasını öğrenin

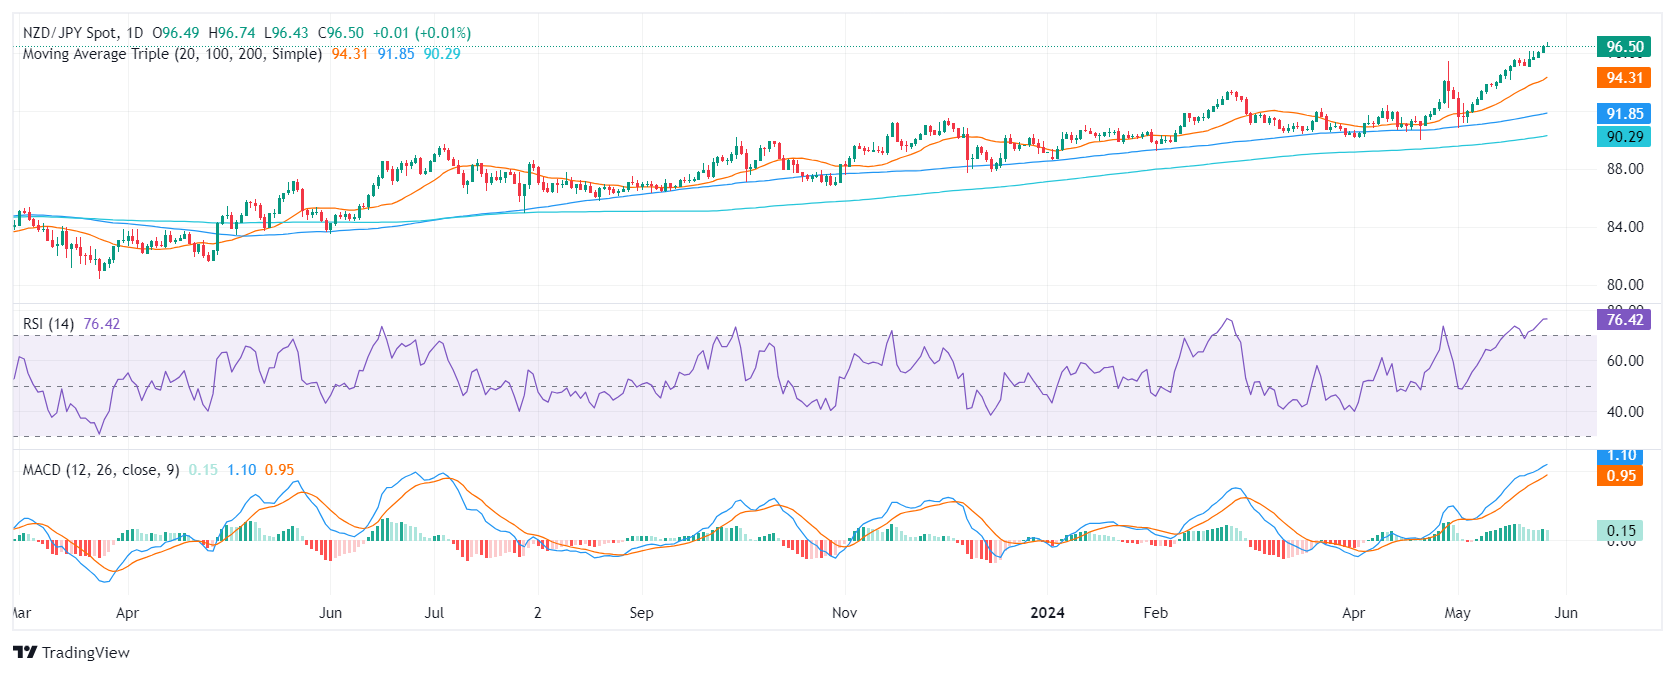
On Tuesday's session, the NZD/JPY pair rose to 96.62 it highest level since July 2007. The outlook has shifted to cautious, with signs of a possible reversal in momentum as indicators flash overbought signals, but the overall bullish outlook remains intact.
Based on the daily chart indicators, the Relative Strength Index (RSI) consistently reflects overbought conditions standing deep in the overbought threshold. This hints at a potential downward price correction. Concurrently, the Moving Average Convergence Divergence (MACD) evidences continued positive momentum with its flat green bars.
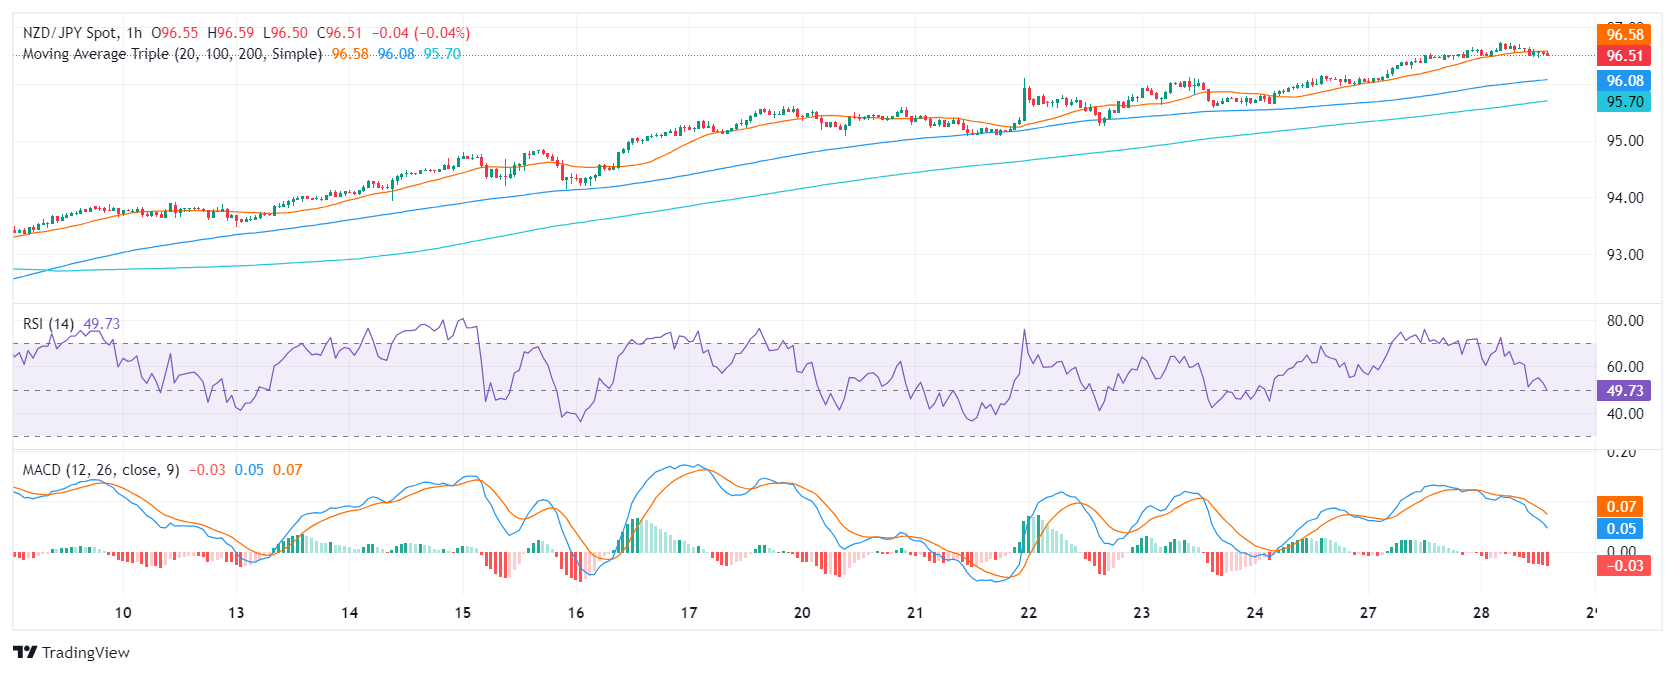
Looking at the hourly chart, the RSI demonstrates lower strength compared to the daily view and has already started to edge downwards. In line with that, the MACD histogram suggests negative momentum as revealed by the presence of red bars.
In the broader context, the NZD/JPY presently exhibits a strong uptrend, as displayed by its position above the 20, 100, and 200-day Simple Moving Averages (SMA). This indicates that the currency pair's short-term gains are exceeding both its medium and long-term averages.
As a correction looms, any downward movements that keep the pair above its SMAs could be considered corrective, with the first strong support seen at around 95.00.


