Confirming you are not from the U.S. or the Philippines

Bu beyanı vererek, şunları açıkça beyan ve teyit ederim:
  • Bir ABD vatandaşı değilim veya ABD'de ikamet etmiyorum.
  • Filipinler'de ikamet etmiyorum
  • ABD'de yaşayan kişilerin hisselerinin/oy haklarının/çıkarlarının doğrudan veya dolaylı olarak %10'undan fazlasına sahip değilim ve/veya ABD vatandaşlarını veya ABD'de yaşayanları başka yollarla kontrol etmiyorum.
  • Hisselerin/oy haklarının/çıkarlarının %10'undan fazlasının doğrudan veya dolaylı mülkiyeti altında tutan ve/veya başka araçlarla kullanılan ABD vatandaşı veya vergi mükellefinin kontrolü altında değilim.
  • FATCA Bölüm 1504(a) uyarınca, ABD vatandaşları veya mükellefleri ile herhangi bir bağlantım yoktur.
  • Yanlış beyanda bulunmanın getirdiği sorumluluğun farkındayım.
Bu beyanın amaçları doğrultusunda, ABD'ye bağımlı tüm ülkeler ve topraklar, ABD'nin ana topraklarına eşittir. Bu beyanımın ihlalinden kaynaklanan veya bununla ilgili herhangi bir iddiaya karşı Octa Markets Incorporated'ı, yöneticilerini ve görevlilerini savunmayı ve zarar görmemesini sağlamayı taahhüt ederim.
Kendimizi gizliliğinize ve kişisel bilgilerinizin güvenliğine adadık. E-postaları yalnızca özel teklifler ve ürünlerimiz ve hizmetlerimiz hakkında önemli bilgiler sağlamak için topluyoruz. E-posta adresinizi göndererek bizden bu tür mektupları almayı kabul etmiş olursunuz. Abonelikten çıkmak istiyorsanız veya herhangi bir sorunuz ya da endişeniz varsa Müşteri Desteğimize yazın.

Important information

By accessing this website, you confirm that you are not a citizen of the European Union or the United States of America, and that you are not a resident of, or accessing the website from, Canada, the European Union, India, Iran, Myanmar, North Korea, Pakistan, the Philippines, the United Kingdom, or the United States of America. We assume no liability for any consequences arising from the violation of applicable local laws.

Back

NZD/USD Price Analysis: Short-term uptrend hinted, buyers might take some profits

  • The daily RSI shows minor buying traction, further validation is needed.
  • The hourly chart reveals growing buying momentum with RSI hitting overbought terrain.
  • Buyers finally recovered the 20-day SMA, which brightens the outlook for the short term.

The NZD/USD rose to 0.5961, displaying a rally of 0.56% and jumping above the key short-term 20-day Simple Moving Average (SMA) on Thursday which now indicates a potential bullish bias. However, the broader trend remains bearish. With the intense increase in buying traction on an hourly scale, buyers might take some profits ahead of the Asian session.

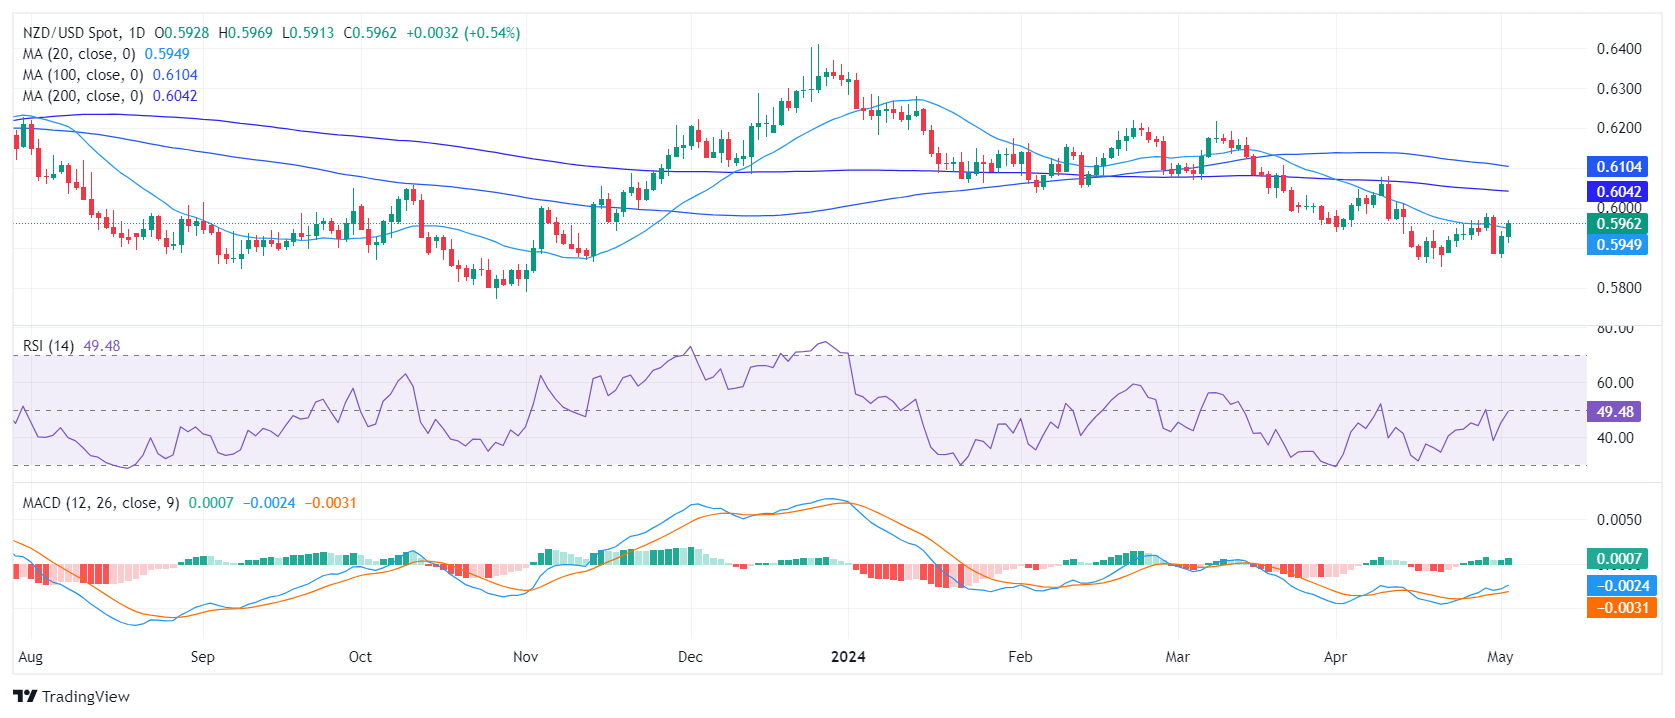
On the daily chart, the Relative Strength Index (RSI) stands just above negative territory threshold, hinting at a slight uptrend. However, this inconclusive signal requires further validation to be considered a bullish flag.

NZD/USD daily chart

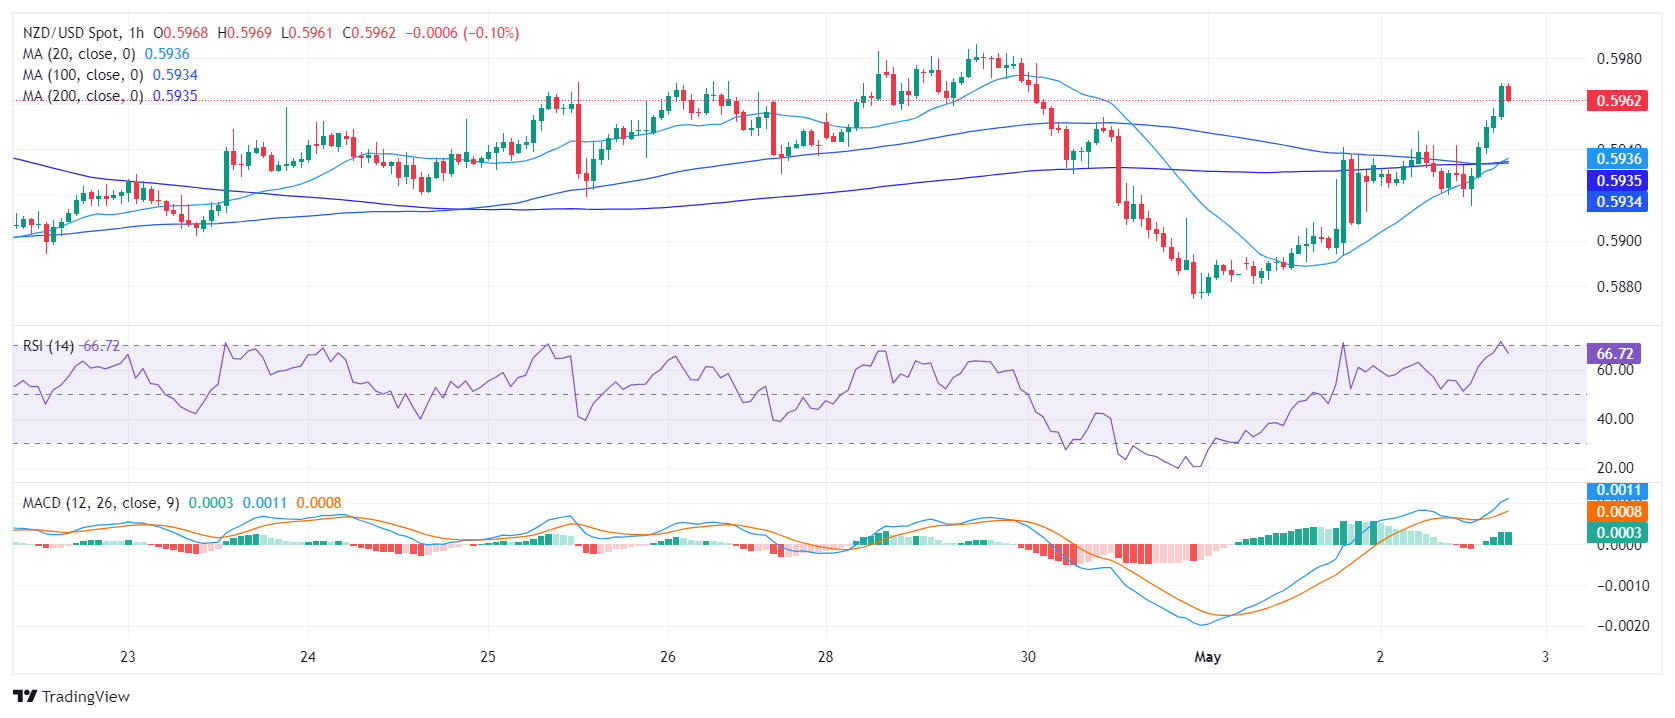
On the hourly chart, the RSI is at 66 slightly down after hitting the overbought threshold. This indicates a stronger short-term buying momentum but that the pair may start to consolidate ahead of Friday’s session. Furthermore, the Moving Average Convergence Divergence (MACD) presents green bars, showing positive momentum.

NZD/USD hourly chart

Considering broader market movements, the NZD/USD’s jump above the 20-day Simple Moving Average (SMA), signify a potential short-term upward trend. However, the pair still lingers below the 100 and 200-day SMA, implying sustained selling pressure and a bearish market bias long-term. That being said, bulls are making arguments to be considered seriously and will start to set their sight at the 100-day SMA at 0.6100.


NZD/USD

Overview
Today last price 0.596
Today Daily Change 0.0030
Today Daily Change % 0.51
Today daily open 0.593
 
Trends
Daily SMA20 0.5952
Daily SMA50 0.6031
Daily SMA100 0.6106
Daily SMA200 0.6043
 
Levels
Previous Daily High 0.5941
Previous Daily Low 0.5875
Previous Weekly High 0.597
Previous Weekly Low 0.5886
Previous Monthly High 0.6079
Previous Monthly Low 0.5851
Daily Fibonacci 38.2% 0.5916
Daily Fibonacci 61.8% 0.59
Daily Pivot Point S1 0.5889
Daily Pivot Point S2 0.5849
Daily Pivot Point S3 0.5823
Daily Pivot Point R1 0.5956
Daily Pivot Point R2 0.5981
Daily Pivot Point R3 0.6022


Gold price slumps amid falling US yields, weak US Dollar

Gold price clings to the $2,300 figure in the mid-North American session on Thursday amid an upbeat market sentiment, falling US Treasury yields, and a softer US Dollar.
Devamını oku Previous

USD/JPY Price Analysis: Drops to a two-week low, at around 153.00

The Japanese Yen (JPY) extended its gains versus the US Dollar (USD) amid a suspected intervention by the Bank of Japan (BoJ) that happened late on Wednesday during the North American session.
Devamını oku Next