Confirming you are not from the U.S. or the Philippines

Bu beyanı vererek, şunları açıkça beyan ve teyit ederim:
  • Bir ABD vatandaşı değilim veya ABD'de ikamet etmiyorum.
  • Filipinler'de ikamet etmiyorum
  • ABD'de yaşayan kişilerin hisselerinin/oy haklarının/çıkarlarının doğrudan veya dolaylı olarak %10'undan fazlasına sahip değilim ve/veya ABD vatandaşlarını veya ABD'de yaşayanları başka yollarla kontrol etmiyorum.
  • Hisselerin/oy haklarının/çıkarlarının %10'undan fazlasının doğrudan veya dolaylı mülkiyeti altında tutan ve/veya başka araçlarla kullanılan ABD vatandaşı veya vergi mükellefinin kontrolü altında değilim.
  • FATCA Bölüm 1504(a) uyarınca, ABD vatandaşları veya mükellefleri ile herhangi bir bağlantım yoktur.
  • Yanlış beyanda bulunmanın getirdiği sorumluluğun farkındayım.
Bu beyanın amaçları doğrultusunda, ABD'ye bağımlı tüm ülkeler ve topraklar, ABD'nin ana topraklarına eşittir. Bu beyanımın ihlalinden kaynaklanan veya bununla ilgili herhangi bir iddiaya karşı Octa Markets Incorporated'ı, yöneticilerini ve görevlilerini savunmayı ve zarar görmemesini sağlamayı taahhüt ederim.
Kendimizi gizliliğinize ve kişisel bilgilerinizin güvenliğine adadık. E-postaları yalnızca özel teklifler ve ürünlerimiz ve hizmetlerimiz hakkında önemli bilgiler sağlamak için topluyoruz. E-posta adresinizi göndererek bizden bu tür mektupları almayı kabul etmiş olursunuz. Abonelikten çıkmak istiyorsanız veya herhangi bir sorunuz ya da endişeniz varsa Müşteri Desteğimize yazın.
Octa trading broker
Yatırım hesabı aç
Back

GBP/USD Price Analysis: Needs to spend more time amid volatility contraction

  • A minor rebound in risk-off impulse has dragged the cable below 1.1300.
  • The DXY has reclaimed the critical resistance of 112.00.
  • A symmetrical triangle formation indicates a consolidation head.

The GBP/USD pair has witnessed mild selling pressure and has dropped below the critical support of 1.1300 in the early European session. A soft decline in the S&P500 futures has delivered a rebound in the risk-off profile. The US dollar index (DXY) has reclaimed the critical resistance of 112.00 and has also delivered an upside break of the morning consolidation range.

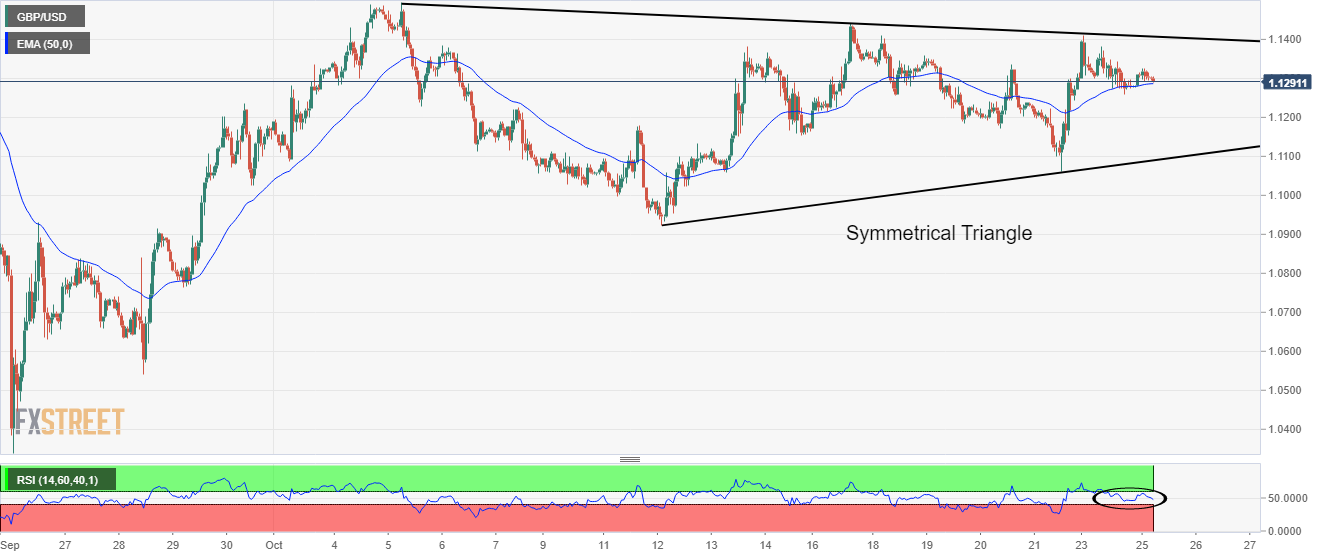
On an hourly scale, the cable is oscillating in a Symmetrical Triangle chart pattern that signals a volatility contraction. The upward-sloping trendline of the chart pattern is placed from October 12 low at 1.0924 while the downward-sloping trendline is plotted from October 5 high at 1.1496.

The 50-period Exponential Moving Average (EMA) at 1.1291 is overlapping with the asset, which indicated a rangebound structure.

Also, the Relative Strength Index (RSI) (14) is oscillating in a 40.00-60.00 range, which indicates the unavailability of a potential trigger.

Going forward, an upside break of October 17 high at 1.1440 will drive the cable towards September 14 high at 1.1590, followed by September 13 high at 1.1738.

On the flip side, a drop below Friday’s low at 1.1060 will drag the asset toward the psychological support of 1.1000. If cable surrenders the psychological support, it will expose to more downside towards October 12 low at 1.0924.

GBP/USD hourly chart
 

Sweden Producer Price Index (YoY) above expectations (19.9%) in September: Actual (20.6%)

Sweden Producer Price Index (YoY) above expectations (19.9%) in September: Actual (20.6%)
Devamını oku Previous

EUR/USD: There will likely be a deadlock for now – Commerzbank

EUR/USD remains to trade below the 0.99 mark. Economists at Commerzbank note that there is a deadlock in the world's most popular currency pair. The s
Devamını oku Next